The Normal Distribution
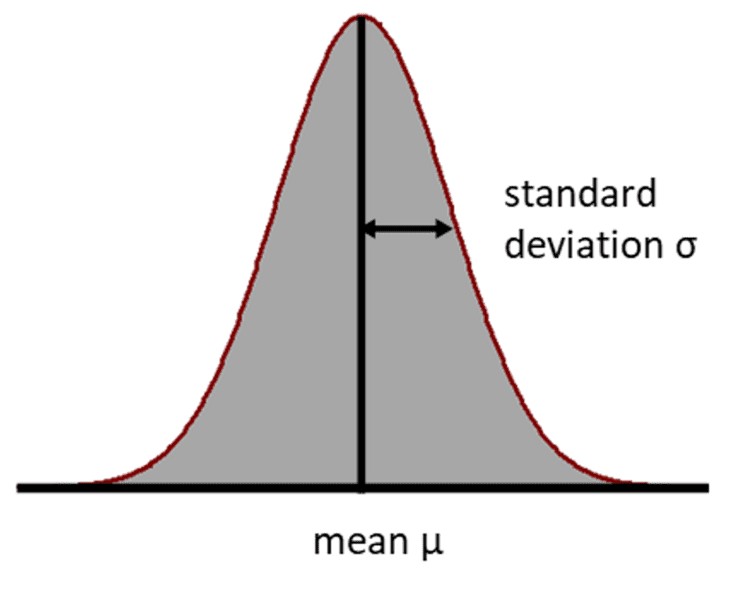
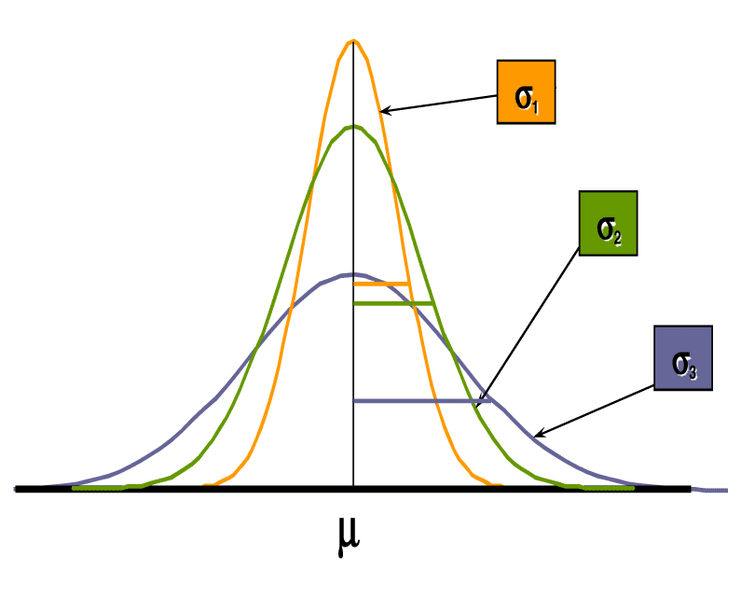
The normal distribution, also known as the Gaussian distribution, is the most frequently used statistical distribution. The deviations of the (measured) values of many scientific, economic and engineering processes from the mean value can often be described in a good approximation by the normal distribution. Its probability density is a bell-shaped curve that runs symmetrically around the mean value (Gaussian bell curve). For some statistical analyses, the data must come from an approximately normally distributed population. The normal distribution is then used as a model
for further data analyses.
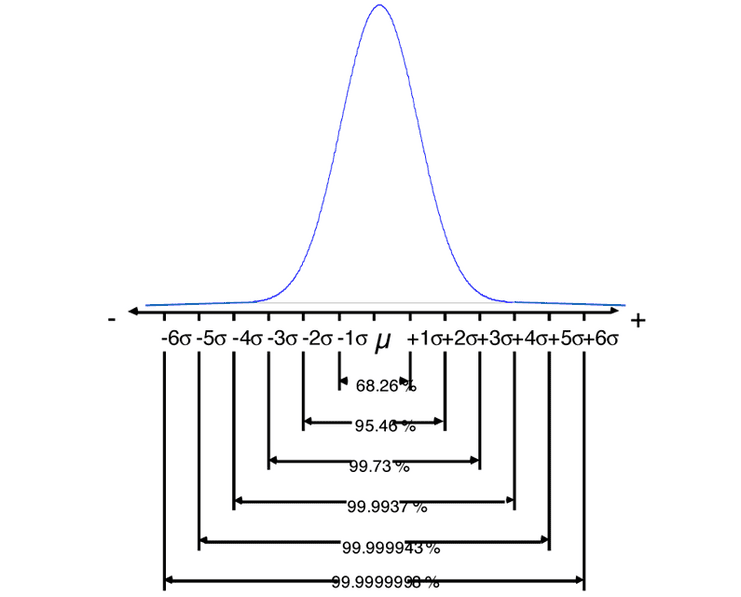
For any normal distribution, we find within
+ 1 standard deviation approx. 68% of all process results
+ 2 standard deviations approx. 95% of all process results
+ 3 standard deviations approx. 99,73% of all process results
The percentages correspond to the proportionate area under the curve (probabilities) up to the respective numbers of
standard deviations.
The area + 3 standard deviations is called the area of natural process variation.
Normal distribution in PDF format
Further training opportunities ...
... can be found in the Education and Training section!
... can be found in the Education and Training section!
...... or simply give us a call or send us an e-mail. We will be happy to help you!
...... or simply give us a call or send us an e-mail. We will be happy to help you!


