
Attributive and Variable Data
Attributive and Variable Data
In Six Sigma projects and the associated statistical evaluations, statements about process capabilities and critical process inputs should be made based on the available data. In order to select the right graphical and statistical tools, it must be clear what type of data is being used.
The data can be divided into the following subgroups:
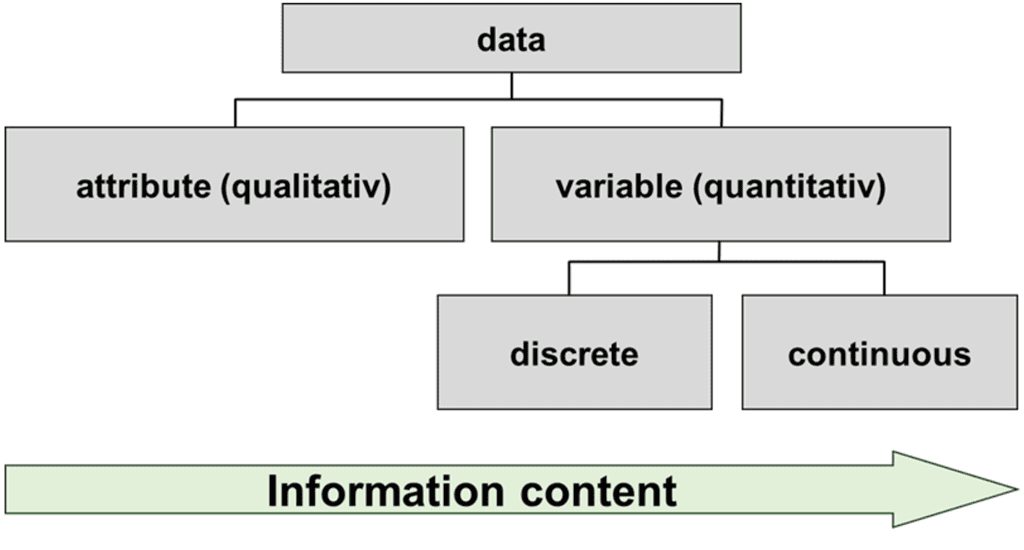
Attributive Data
Attributive / qualitative data can be divided into different categories. Characteristics of a process, product or feature can be described. For each category, it is possible to count how often it occurs.
Examples of possible categories are:
- Error classes
- good / bad
- Machine 1, Machine 2, Machine 3
- Different locations
- Early shift, late shift
An indication of whether the data is attributive or not can be found in whether mathematical operations can be performed on the raw data. If it is attributive data, mathematical operations do not make sense.
Variable Data
Variable data are further subdivided into discrete data and continuous data.
Discrete Data
Discrete data are the results of counts, i.e. integer data.
Examples of discrete data are:
- Number of machine breakdowns per month
- Number of faulty invoices per week
- Number of customer complaints
- Number of operations carried out
Continuous Data
Continuous data are measured values, they can have any numerical value. Any decimal subdivision is possible.
Examples of continuous data are:
- Time
- Pressure
- Belt speed
- Cost
- Dimensions
Expressiveness
The strength of the data is only sufficient with attributive data if the sample size is very high. Furthermore, there are often problems with the ability of the attributive tests.
Therefore: Always strive for continuous data to achieve maximum information content!
... can be found in the Education and Training section!
...... or simply give us a call or send us an e-mail. We will be happy to help you!